Self Textbook notes
2.3 Two Random Variables
Joint and Marginal Distributions
The Joint Probability Density Distribution and the Marginal Probability Distribution
Conditional Distributions
The distribution of a random variable conditional on another random variable taking on a specific value is called the conditional distribution of given , it is written as
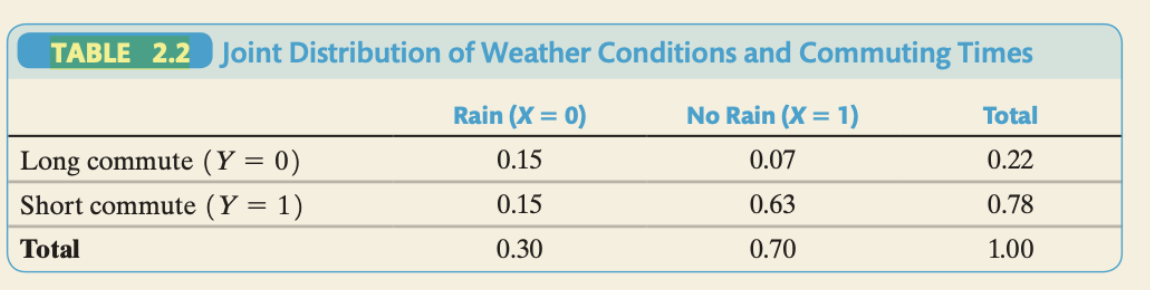
In the table 2.2, the could be expressed that what is the prob of a long commute if I already know it is raining?
That is asking , and it is equals to
Remember the second part is the event that you already know.
Expected value and variance of a linear function
The basic knowledge: Variance
Prove: if then , why?
Since so that
(the right part is the )
So
Prove: :
==Remember, , so:==
Moments
Both Mean and Variance belong to a class of measures, called Moments
It is divided by the Raw Moments and the Central Moments
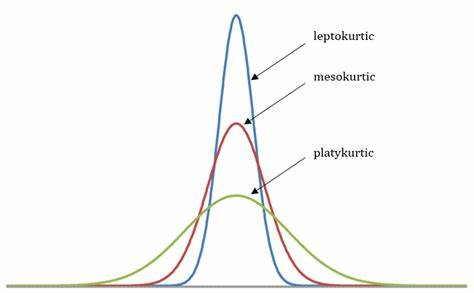
Calculate the skewness:
(measure the thickness of the tails)
Standard Deviation
The Standard Deviation of is denoted as , also the
Joint and Marginal Distributions
The Joint Probability Density Distribution is the probability that two Discrete Random Variable and simultaneously take on particular values. (say and )
The law of iterated expectations
Law of Iterated Expectations is the mean of Y is the weighted average of the conditional expectation of given X, weighted by the prob distribution of
So that the expectation of is the expectation of the conditional expectation of given ,
And this is the core of Law of Iterated Expectations
The Independence
The Discrete Case
Independence Two random variables and are said to be independently distributed if
Since the conditional distribution implies that
That is
Then the and are independent.
The Continuous Case
is independent of :
We use Correlation Coefficient to estimate the strength of the 2 variables.
It is rescaled to be between to , and it is also unit free.
How to compute ? See Covariance
If , it is perfect positive linear relation
If , it is perfect negative linear relation
(Most of the time the Correlation Coefficient would be between when estimate econometrics problem.)
That is, we use absolute value to reflects the strength of linear association between the 2 variables.
Independence vs. Uncorrelation
It is claimed that Independence ⇒ , but not vice versa. (Think of the question )
This is why we have to highlight the “linear” in
That is, we use absolute value to reflects the strength of linear association between the 2 variables.
The independence only hold if has no relationship (neither linear nor nonlinear) of !