It is also a technique of Non-parameter Statistic.
This is a update of the Correlation Coefficient, Because sometimes the variables maybe ordinal, or the normality requirement can’t be satisfied.
So we have to use this technique to solve such problems
Spearman correlation coefficient is labeled as , sample statistic used to estimate its value is labeled as
Notice that and are the ranks of and ,
Hypothesis
Always remember we have to estimate whether and have linear relationship.
: Wilcoxon rank sum test :
We have to refer to the table to test whether to refuse the hypothesis.
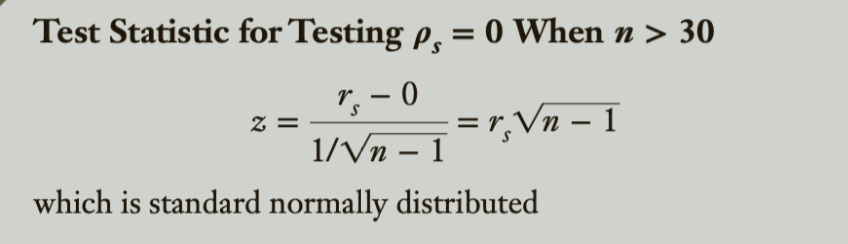
When , the test statistic becomes
Spearman = 检查”排名”是否一致,不管具体数值
📊 关键区别
普通相关(Pearson):看数值
原始得分 vs 等权重得分:

广东: 183 vs 185 ← 数值接近
浙江: 180 vs 178
辽宁: 150 vs 148

Pearson = 0.751(看数值相关性)
Spearman:只看排名
原始排名 vs 等权重排名:

原始:  广东(1) 浙江(2) 四川(3) 新疆(4) 辽宁(5)
等权重: 广东(1) 浙江(2) 四川(3) 新疆(4) 辽宁(5)

Spearman = 1.0(排名完全一致)
🎯 为什么需要?
稳健性检验的核心问题:
"如果换个权重,省份排名会乱掉吗?"

我们关心的是:
✓ 广东还是第一吗?
✓ 辽宁还是最后吗?
✓ 相对顺序变了吗?

不太关心:
? 广东是183还是185?
Spearman专门测排名一致性!
📈 实际例子
如果Spearman很高(>0.8):
→ 排名稳定
→ 换权重也不影响结论
→ ✓ 稳健

如果Spearman很低(<0.5):
→ 排名变来变去
→ 对权重太敏感
→ ✗ 不稳健
✅ Presentation中说:
"I used Spearman correlation to check ranking consistency.

Spearman = 0.749 with equal weights

This means the provincial ranking is stable
even when we change the weighting scheme.

High Spearman ensures our conclusions about
'who ranks higher' are robust."
核心:Pearson看数值,Spearman看排名! ✅