It is from the Statistical Process Control
chart
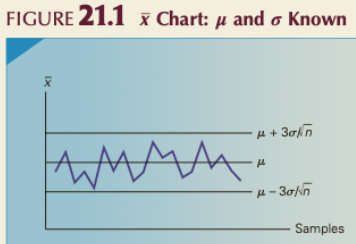
A Control chart is a plot of statistics over time, the picture shown here is called chart, (see x chart), with a center line and control limit. The control limit can then be described as upper control limit and lower control limit.
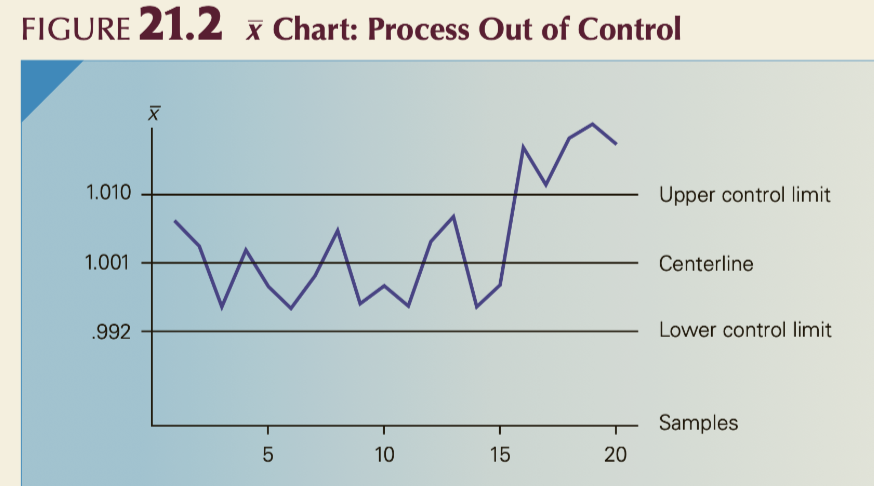
If every points are randomly distributed between the control limits, we conclude that the process is under control, otherwise out of control.
The standard deviation is
chart
Similar to the chart, the chart also shows the central line and the
Control charts for attributes: P chart
Hypothesis
: The process is under control.
: The process is out of control.
If there is a point that is out of the region, we reject ,
我的想法
如何判断过程是否失控?在 minitab 里面有八钟检验方式,只要出现其中一种就可以认为图形是失控的,每一个区间(A 区, B 区,C 区都可以被看做一个标准差)